NA-AI AnalyticsAnalyze, automate, and predict every key metric in one AI-native workspace.
NA-AI Analytics connects to your product, revenue, and marketing stack, then uses AI to explore your data, surface anomalies, generate reports, and suggest next best actions — without writing a single query.
NA-AI · Product & Revenue Insights
See the real impact of every product and revenue decision.
NA-AI turns raw product, revenue and marketing events into AI-ready insights your teams can trust — so PM, Growth and RevOps can move faster without juggling dashboards or writing SQL.
AI-native analytics, out of the box
NA-AI ingests your product and revenue events (Snowplow, Segment, RudderStack, custom…) and normalizes them into AI-ready entities — so every team can ask questions, run analyses and get narratives without ever touching SQL.
- Time-to-insight
- -72%
- SQL needed
- 0 lines
Secure by design
Role-based access control, PII masking and real-time audit logs are built directly into the core of NA-AI — so your analytics stay fast without sacrificing security.
- Granular access by role, workspace and product scope (advanced RBAC).
- Sensitive fields pseudonymized by default (PII, tokens, internal IDs).
- Detailed audit trail on every access, export and shared insight.
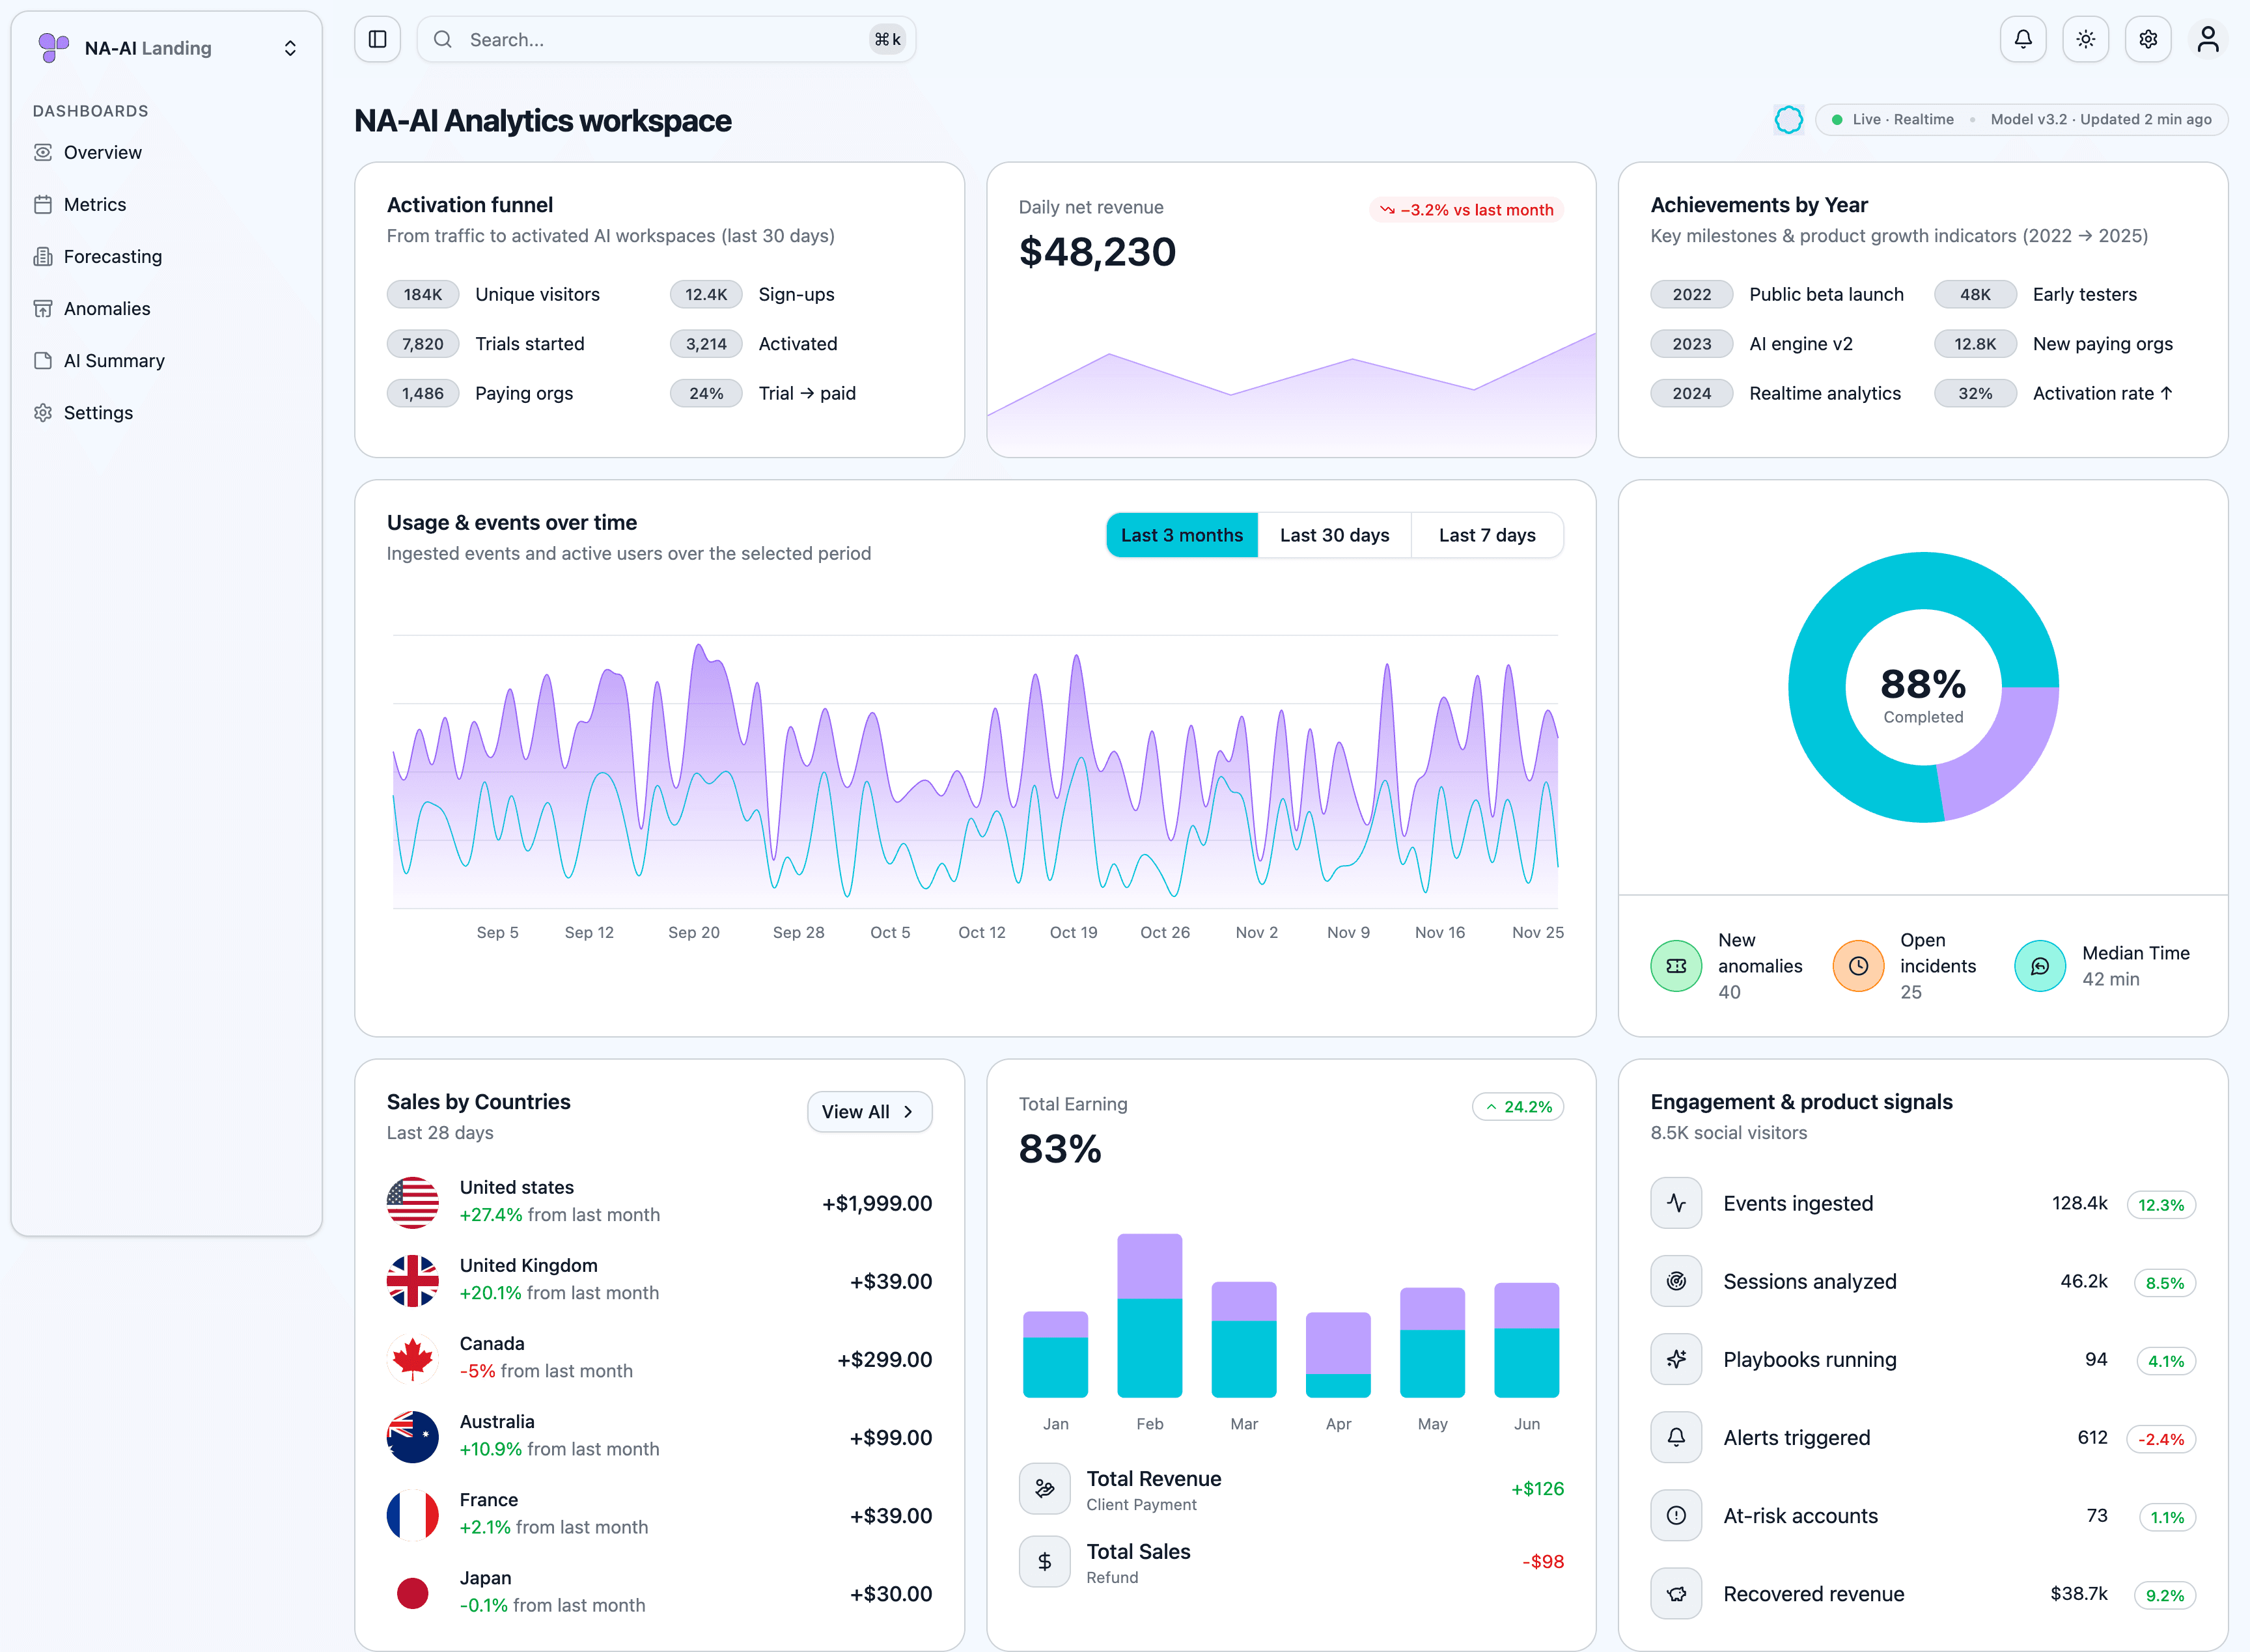
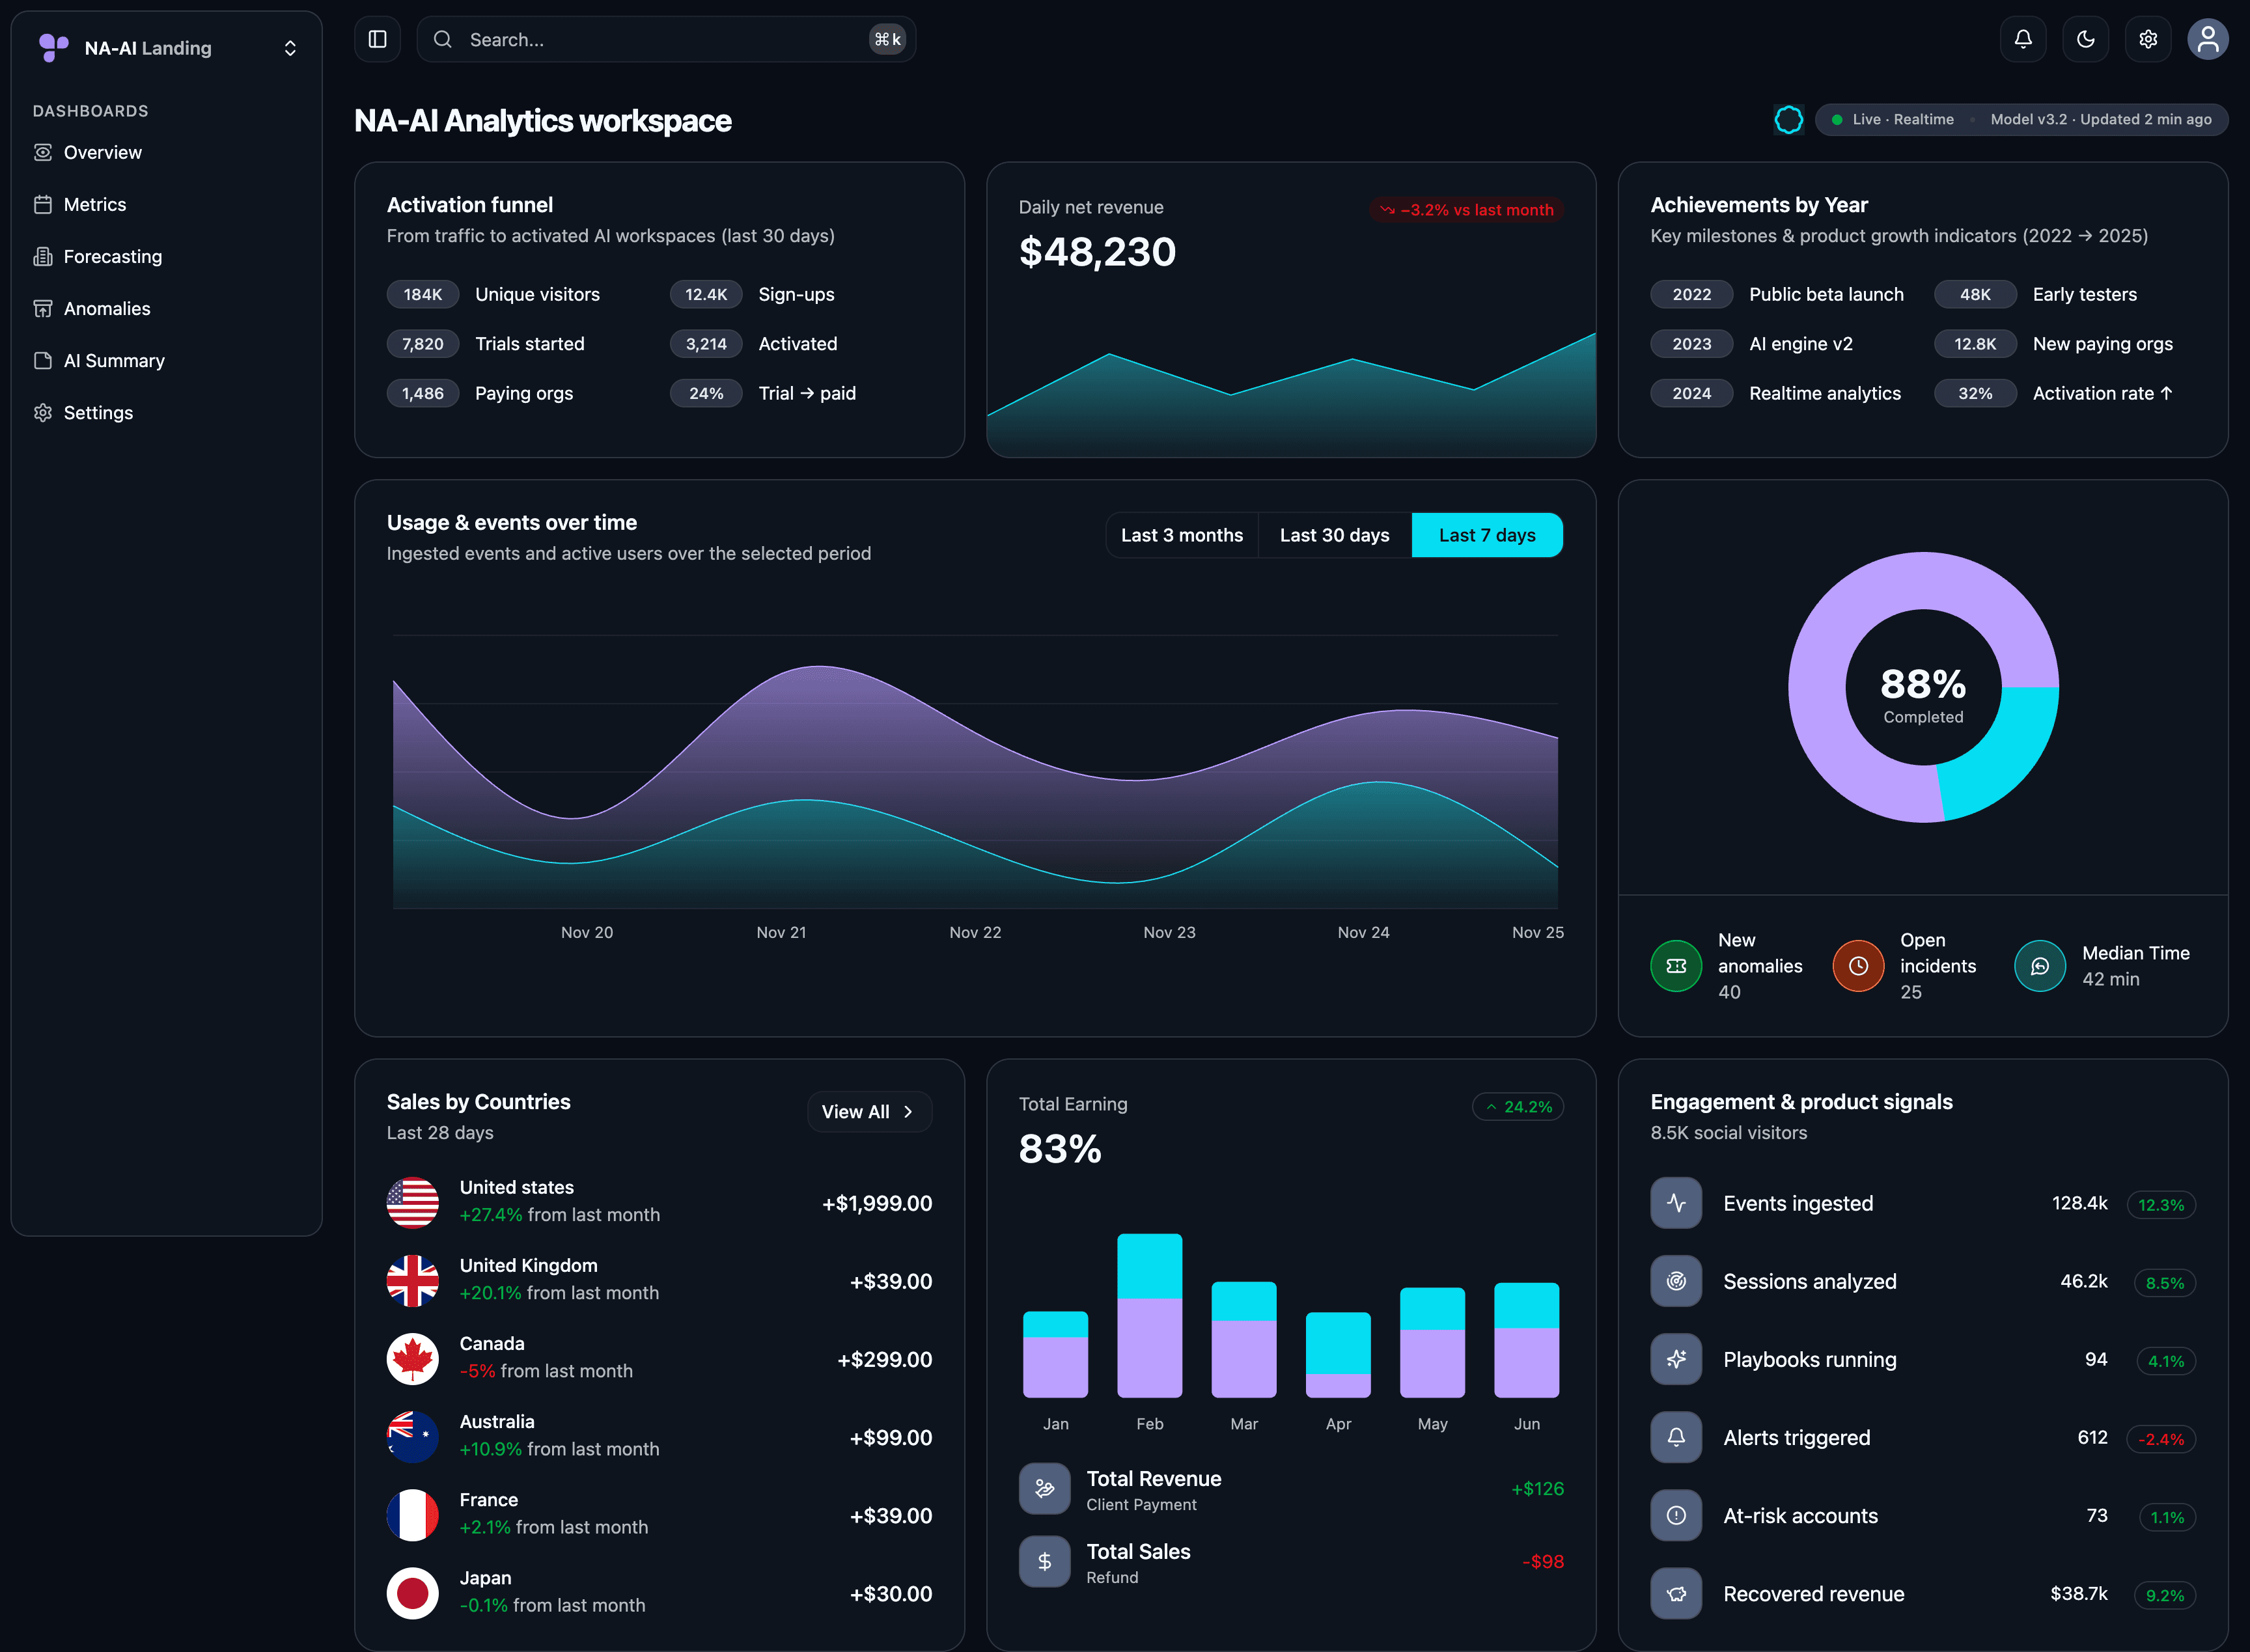
Average net revenue
$48,230 / day
30-day rolling average · healthy and sustained growth.
Growth driven by annual plans and improved onboarding.
Consolidated across products and segments (B2B & B2C).
Ask NA-AI follow-up questions directly from this view — no extra dashboard needed.
Revenue by platform
Last 51 days · daily revenue index, normalized.
52% of indexed revenue on desktop · 48% on mobile over the last 51 days.
Track monetization signals, channel volume and high-yield segments across desktop and mobile – in a single, AI-ready chart that works out of the box in your dashboard.
Daily revenue index (normalized). Hover any bar to inspect a specific day and platform.
Product, Growth and RevOps teams use this view in weekly revenue reviews to spot platform shifts, correlate launches with usage and refine acquisition or pricing experiments.
Global revenue by country
Last 28 days
NA-AI combines product usage and billing data to highlight where your MRR is accelerating, which markets deserve a dedicated expansion playbook, and where to focus Sales & Success.
- United States+27.4% vs last month · net revenue+$1,999.00
- Japan+22.3% vs last month · net revenue+$720.00
- Germany+19.8% vs last month · net revenue+$540.00
- China+17.1% vs last month · net revenue+$460.00
- France+15.2% vs last month · net revenue+$410.00
- United Kingdom+11.4% vs last month · net revenue+$310.00
- Switzerland+9.3% vs last month · net revenue+$260.00
- Canada+7.8% vs last month · net revenue+$210.00
- Italy+5.8% vs last month · net revenue+$160.00


'/%3e%3cuse xlink:href='%23a' transform='rotate(23.036 .093 25.536)'/%3e%3cuse xlink:href='%23a' transform='rotate(45.87 1.273 16.18)'/%3e%3cuse xlink:href='%23a' transform='rotate(69.945 .996 12.078)'/%3e%3cuse xlink:href='%23a' transform='rotate(20.66 -19.689 31.932)'/%3e%3c/svg%3e)

'%3e%3cpath fill='%23012169' d='M0 0v30h60V0z'/%3e%3cpath stroke='%23fff' stroke-width='6' d='m0 0 60 30m0-30L0 30'/%3e%3cpath stroke='%23C8102E' stroke-width='4' d='m0 0 60 30m0-30L0 30' clip-path='url(%23b)'/%3e%3cpath stroke='%23fff' stroke-width='10' d='M30 0v30M0 15h60'/%3e%3cpath stroke='%23C8102E' stroke-width='6' d='M30 0v30M0 15h60'/%3e%3c/g%3e%3c/svg%3e)


Integrations · data, revenue & collaboration
Connect NA-AI to the stack you already use.
NA-AI Analytics plugs into your data warehouse, billing tools and product analytics to generate trusted, actionable insights — without rebuilding your stack from scratch.
The integrations shown (BigQuery, Snowflake, Stripe, Segment, Mixpanel, Amplitude, Slack, Notion, etc.) are realistic examples for the template. Replace, extend or rename them to match your own stack in minutes.
Pricing · NA-AI Analytics
Pricing that scales with your product.
Start in minutes, then let NA-AI Analytics grow with your MRR, team and data stack — without long-term contracts or painful implementations.
Need more details? .
Starter
For small product teams that want to start using AI on their core metrics without rebuilding their data stack.
- Connect up to 3 data sources (product, CRM, billing).
- AI-powered baseline dashboards (usage, retention, MRR).
- Weekly auto-generated reports sent to your inbox.
- Email alerts on the most important anomalies.
Growth
Most popularFor growing SaaS teams that need advanced analysis, intelligent alerts and forecasting across the full funnel.
- Everything in Starter.
- Multi-dimensional anomaly detection with AI explanations.
- Scheduled reports for Product, Marketing and Leadership.
- MRR, activation and churn forecasting with scenarios.
- AI playbooks to turn insights into concrete actions.
Enterprise
For data-driven organizations that want to connect all teams and systems to NA-AI with full governance.
- Advanced connections (warehouse, data lake, custom CRM).
- Workspaces per team with governance and granular permissions.
- SLAs, dedicated onboarding and hands-on data support.
- Exports into your existing stack (Slack, Notion, BI tools, etc.).
Free trial, then monthly or annual billing. Cancel anytime. Enterprise pricing is tailored to your stack, data volume and security requirements.
Compare plans side by side.
Choose the level that matches your product maturity and data stack. You can upgrade or downgrade between plans at any time.
| Features | Starter | Growth | Enterprise |
|---|---|---|---|
| Core analytics | |||
AI-powered dashboardsHigh-level view of your key product and revenue metrics. | |||
Natural language questionsAsk questions without SQL or complex filters. | |||
Custom metrics & segments | Basic | Advanced | Full |
| Automation & alerts | |||
Scheduled reports | Weekly | Daily + weekly | Custom |
Anomaly detection & alertsConversion drops, churn spikes and other critical anomalies. | |||
AI playbooks out of the boxActionable recommendations generated from your insights. | |||
| Forecasting & scenarios | |||
Revenue & MRR forecasting | |||
Scenario planning (pricing, churn, acquisition) | Standard | Advanced | |
| Collaboration & governance | |||
Multi-workspace (Product, Growth, Leadership) | |||
Role-based access control | Basic | Advanced | Enterprise-grade |
SLAs, onboarding & dedicated support | |||
Start on Starter to validate NA-AI’s AI capabilities, then move to Growth or Enterprise as your data volume and automation needs increase.
Customer stories
Trusted by product, growth and data leaders
Teams rely on NA-AI to detect anomalies, stay aligned on metrics and turn complex data into confident decisions — without overloading the data team.

“NA-AI automatically flags critical anomalies in our funnels. We win days on key decisions and save dozens of hours of manual analysis every month.”
Albert Grayson
VP Product, NovaFlow

“The experience feels effortless: instant dashboards, natural-language AI insights and alerts only when something truly moves the needle on revenue.”
Ana Becker
Head of Growth, MetricLoop

“With NA-AI, our non-technical teams ask questions in plain English and get reliable answers without pinging the data team all day long.”
David Laurent
Director of Analytics, Northline

“Our data workloads have been cut in half and internal adoption has exploded thanks to NA-AI’s automated insights and proactive alerting.”
Lina Mensah
Head of Data Engineering, SkyMetrics

“NA-AI has become our intelligence layer on top of the data warehouse. We shortened our product decision cycles by several weeks.”
Paul Jefferson
CPO, Brightlane

“We replaced weeks of manual analysis with an almost instant workflow powered by NA-AI, from the executive committee down to field teams.”
Francesca Romano
VP Data Strategy, Quantivia
FAQ · NA-AI Analytics
Questions about AI, data and security?
Learn how NA-AI connects to your stack, keeps your data secure and makes insights explainable for both product and data teams.
Ready to launch?
Ship an AI-native SaaS landing that actually converts.
Upgrade your SaaS marketing with a production-ready landing page: AI-native visuals, data-first sections and conversion-focused copy, all wired for modern stacks.
Talk to sales
Let’s talk about NA-AI Analytics for your team.
Tell us about your stack, your core metrics and your product or revenue goals. We will come back with a tailored demo and a clear next step.